What Moves the Gold Price: Evidence, Indicators, and Limits
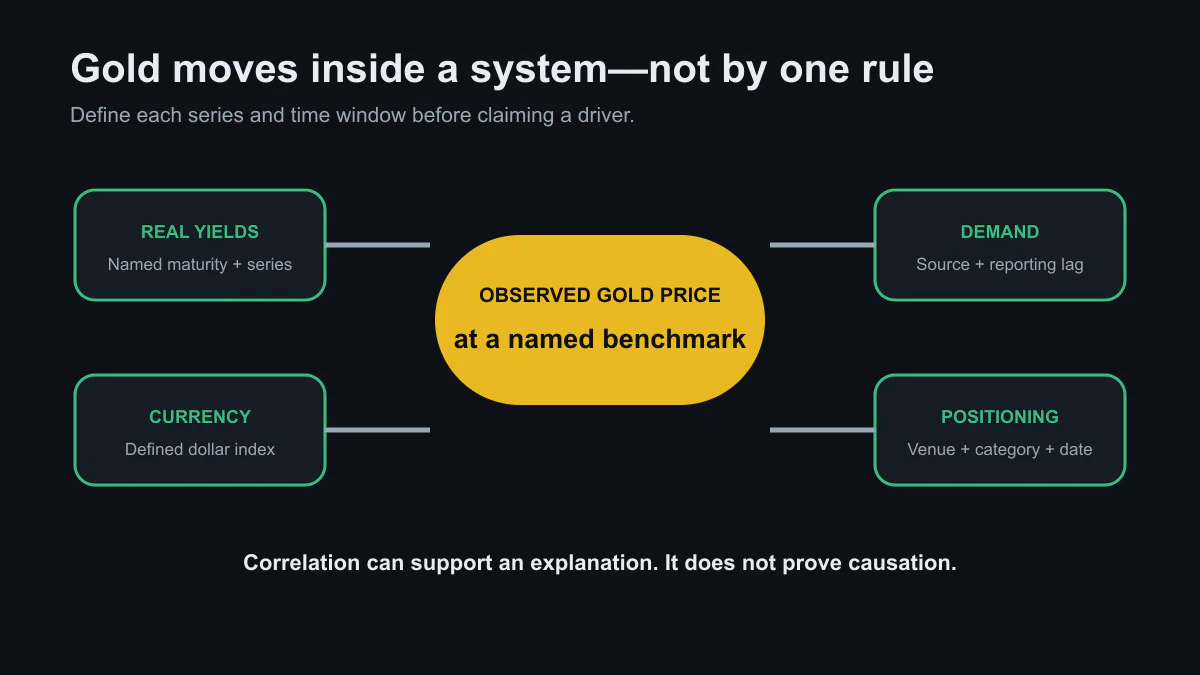
Image: GoldGram
Gold has no issuer earnings or contractual coupon, so analysts often explain its price through other markets. The useful question is not “what is the one driver?” It is which observable forces changed, over what window, and whether the claimed mechanism fits the data.
This is an educational research framework, not a price forecast or trading recommendation.
Source check: 27 July 2026.
Real interest rates
A common mechanism is opportunity cost. When inflation-adjusted yields on high-quality government debt rise, a non-yielding asset may become less attractive at the margin; falling real yields can have the opposite effect. But the relationship is not mechanical.
Choose a defined series. The Cleveland Fed’s 10-year real-interest-rate estimate is model-based. Treasury inflation-protected security yields are market observations but include their own liquidity and term effects. State which one is used and do not silently substitute a central-bank policy rate.
The U.S. dollar
Gold is commonly quoted in U.S. dollars. A stronger dollar can make the same dollar price more expensive in other currencies, while a weaker dollar can reduce that headwind. The Federal Reserve’s Nominal Broad U.S. Dollar Index is one reproducible measure.
Currency and gold can still rise together during a stress event. Measure the relationship over multiple windows instead of treating an inverse correlation as a law.
Physical, investment, and official-sector demand
Jewelry buyers, bar-and-coin buyers, exchange-traded products, central banks, and industrial users do not act for the same reasons. Supply also comes from mines and recycling. Changes in any one category may be offset elsewhere.
Demand datasets can be delayed, estimated, revised, or incomplete. A central bank’s reported reserves may not reveal the date or execution price of each transaction. Label such data as reported holdings or estimated flows rather than direct evidence of the day’s price move.
Futures positioning and liquidity
The CFTC’s Commitments of Traders reports show reportable positions in specified U.S. futures and options markets. They can help describe positioning, but they are not the entire global gold market and do not reveal every trader’s motive.
During a liquidity shock, gold can be sold to meet margin calls even if longer-term demand remains intact. That is one reason a narrative based only on “fear” can fail.
Inflation
Gold is often called an inflation hedge, but the relevant horizon matters. A monthly inflation surprise, long-run inflation expectations, currency confidence, and real yields are different variables. If nominal yields rise faster than inflation expectations, real yields can rise even while measured inflation is high.
A defensible analysis records the CPI series or expectation measure, publication date, observation window, and whether the comparison uses levels or changes.
A practical attribution table
| Claim | Minimum evidence |
|---|---|
| “Real yields drove gold” | Named yield series, gold benchmark, common dates, measured relationship, and competing explanations |
| “The dollar moved gold” | Defined currency index and time window |
| “Central banks supported demand” | Dated reserve or purchase data with reporting limits |
| “Positioning was crowded” | Named CFTC report, contract, category, and report date |
| “Inflation lifted gold” | Defined inflation measure and a mechanism that accounts for nominal yields |
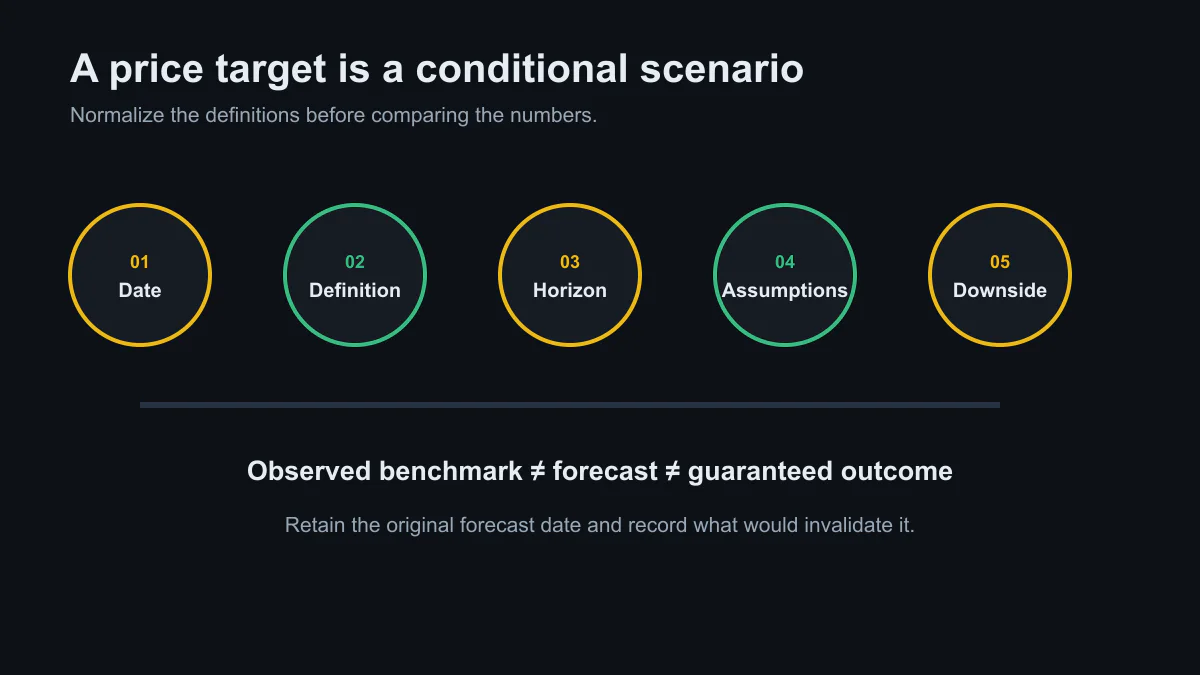
Event timing can strengthen an inference, but correlation alone does not prove causation. If several variables changed together, state that attribution is uncertain.
Primary and authoritative sources
- LBMA: Gold Price benchmark
- FRED: Cleveland Fed 10-year real-interest-rate estimate
- FRED: Federal Reserve broad U.S. dollar index
- CFTC: Commitments of Traders
goldgold priceinterest ratescentral banksmarket explainerprecious metals